Update: 25 July 2023: “Epilogue”
This is an epilogue, to document the outcome, in fairness to Qantas.
All of the issues noted below in this blog post, with the exception of the electronic case management IT tool at Qantas being pretty sucky, are now resolved.
I spent an hour or so being called a number of times by Qantas escalations staff (their escalations team title seems to be ‘Executive Relations’), and we worked through and satisfactorily resolved every open issue that I had. The refunds I asked for have been initiated. My online access works again.
There are a few object lessons for Qantas in this, in my view, that I’ll just take note of, here, in the hope that Qantas Executive Relations is able to take steps to improve these aspects of the customer experience in the future.
#1: The customer-facing aspect of the case handling (i.e. support ticket) handling system used by Qantas is really pretty bad:
- Email sent in does not get an initial automatic response with the case number in it, so a followup to a submission that hasn’t got yet got a reply is… impossible.
- When a case *is* followed up, the case number does not appear to be automatically added, but rather it looks to have to be manually added by a human. I suggest this because of my ongoing issues with receiving case responses with an invalid case number (discovered when my response in turn is rejected and discarded as described in the post below). Huge frustration results.
- The support ticketing system appears to be ‘home brew’ and pretty rubbish, from a customer standpoint. Qantas would do well to invest the trivial sum involved (for their size) in switching to a professional cloud-based case management tool like Zendesk. This would be easy to do, rapid to do, and would radically improve the quality of their online customer support overnight.
#2: Qantas need a customer-accessible escalation mechanism that is not twitter
Writing this post and then tweeting it actually worked as a customer escalation mechanism.
In the absence of a proper, directly accessible escalation mechanism (with a professional online case number/ticket handling system attached, as a pre-requisite), customers will keep using twitter and public embarrassment to get the attention of a high level ‘Executive Relations’ person.
This is inefficient for all concerned and reputationally damaging for Qantas.
Instead, Qantas should have a very clear online path to raise an *escalation* ticket (or to flag, for escalation, any existing open case), with that path linked into a ticketing system that works well… and then have appropriate (senior, empowered, on-shore) staff work that ticket queue.
The resulting improvement in both customer satisfaction and overall customer service (if systemic issues are then fixed) at Qantas would be both rapid and profound.
I am not guessing or speculating here. This is what I did at Internode when that company was ‘my life’…and it really worked.
And now, on to the original blog post…
Complaints handling can be hard when IT systems get in the way
Yes, this is one of those complaint posts about customer service. I’ve written it because this won’t fit in a tweet, but once I’ve written it down here, I can tweet this blog to Qantas instead…this form of escalation is something I’m driven to because of a lack of apparent escalation paths on the Qantas site itself.
For a couple of decades, I ran, and cared for, for a large customer-focussed company – an Internet Services Provider company called Internode. This has, I contend, given me a better than average appreciation of the merits and frustrations inherent in getting customer support ‘right’.
Major world airlines like Qantas have to have pretty good IT systems to survive in the modern world, but – it is still the case that when it comes to customer facing interactions, their IT systems have the sort of problematic faults that are just so very silly (and in most cases, relatively simple to improve).
Sometimes broken IT customer-facing systems can feel, to customers, as if they are actively (and successfully) defending the company from hearing the attempts of customers to get help.
One thing that Qantas could really use (for those who aren’t members of the Chairmans Lounge) is an escalation path for times when attempts to get their customer-facing systems to help you just… don’t help you, and for when you feel like you’re whacking your head against a brick wall.
…And yes, I was in the ‘Chairmans Lounge’ for some years – and that was wonderful in terms of escalation … they have a dedicated escalations team (and a magic email and magic phone number) for when stuff goes awry. I think I miss that escalation path more than the physical Chairmans Lounges…
The story so far
We recently returned from short overseas holiday – a luxury that we hadn’t properly enjoyed since, well, ‘COVID’. Because I have the good fortune of having done pretty well in business, I buy ‘non economy’ seats on airlines when I’m flying with airlines.
There were three of us who poured ourselves off of QF2, an A380, in from London via Singapore, into Sydney, on (cough) ‘very expensive tickets’.
Our connection from Sydney back home to Adelaide (in business class seats) was scheduled (by Qantas) for 1h40m after our landing time into Sydney. Our A380 into Sydney landed slightly ahead of time (tailwinds) and we breezed through customs almost instantly (first aircraft to land into Sydney after curfew). Easily in time to make our connection.
Alas, we then spent most of the next hour standing at the baggage carousel watching other bags come off, before ours finally appeared. We arrived at the domestic bag drop counter just as our domestic flight (on the other side of the airport) was boarding. No chance to get that plane.
(This is despite our bags being tagged with ‘First Class / Priority’ tags, and our bags had been on the same plane all the way from London. It is unclear what the purpose of those tags is, because it didn’t deliver us any… priority…)
The next business class seats to Adelaide were in 8 hours time, so Qantas downgraded us and shoe-horned us into 3 separate rows at the back of the next plane instead.
After we got home, it occurred to me that a downgrade not of our making should really result in Qantas refunding us the ticket price difference for the lost business class seats that their baggage handling had made it impossible for us to use. So I filed a form on the Qantas web site requesting that this be done.
Some days later, I got a response that asked for photos of our boarding passes.
Our boarding passes.
Pieces of cardboard.
In 2023.
Pieces of cardboard that I may or may not still have (genuinely not sure), but that are definitely not in the same state as I am this week (people who buy tickets on airlines… travel to places far away… who knew?)
I wrote back to say (in summary): “Hey, really? Cardboard? Here’s the PDF copy of my original entire itinerary, and your own systems will record exactly which aircraft you moved us to, and will all note exactly which 3 seats, distributed around the very back of the aircraft, we sat in…surely that’s enough data for you to process the refund?”
Now, this is where the fun really starts. In response to that reply, I got a generic error message email – as below:
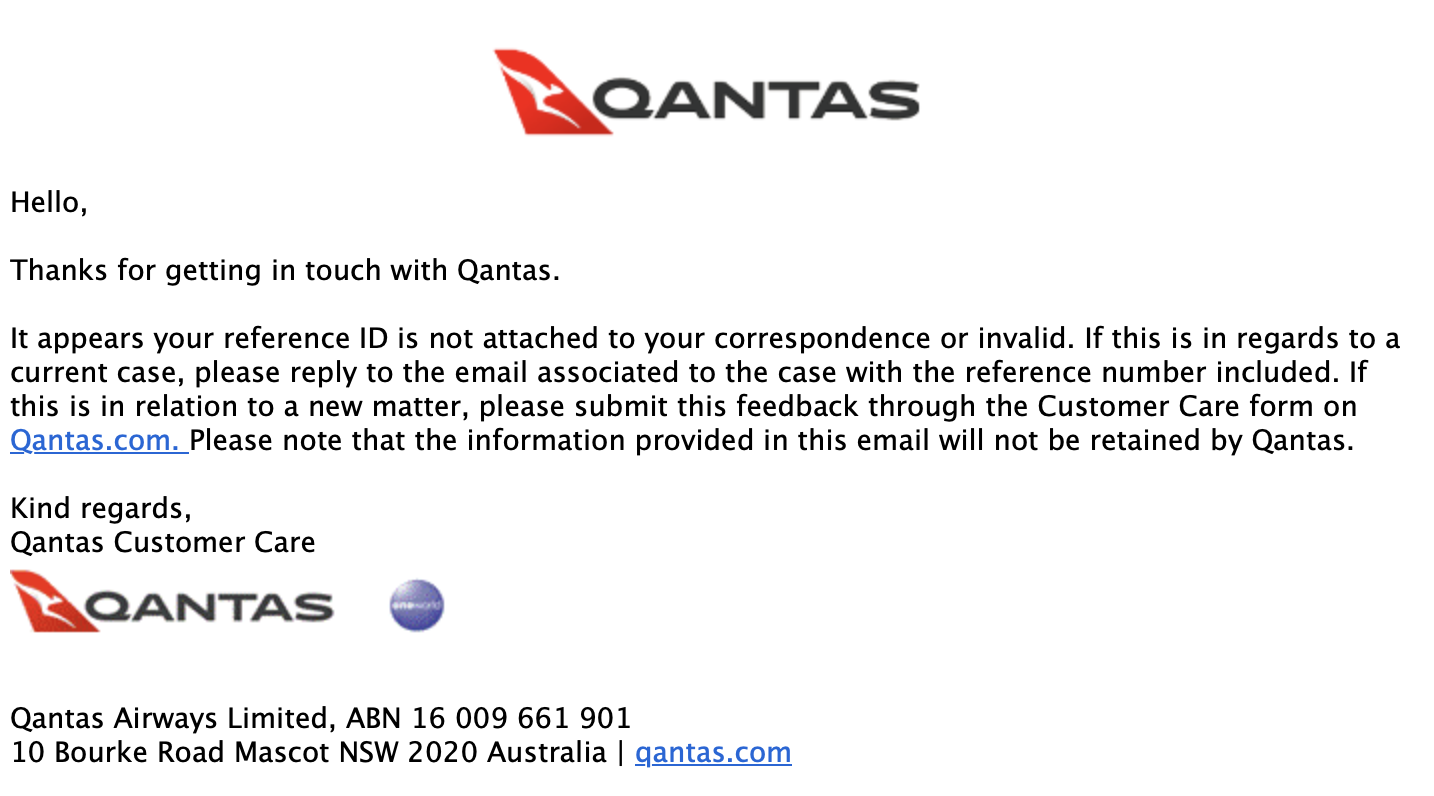
Now, this email is remarkable to me (with my customer service history) in many ways, including:
- All I did was hit ‘reply’ to an email I got from a Qantas staff member. That reply had a ticket number in both the subject line and the message body. Clearly that number was wrong.
- How the hell is the wrong number in an email back from Qantas? Are the replies hand written or cut/paste driven rather than coming out of their actual support system? How much effort does it take to break your own internal ticketing system like that?
- The email (above) says that my reply to an active case has been thrown in the bin. That hardly increases my love of Qantas customer service. How about turning my email into a new ticket so that a human at Qantas bloody reads it and finds the original support ticket and link them? It’s not that hard, you have my email address!
I tried replying again – and (of course) I got the very same ‘Your email is so important to us that we just threw it away, screw you’ response that I got the first time (as above).
So… I’ve been successfully locked out of my original support ticket because I don’t know what the ticket number is, and Qantas botched communicating that one specific item of information back to me.
I’m sure that someone inside Qantas will mark the original support ticket down, one day, as ‘customer never bothered to reply, they must not care’. Argh!!
And (you guessed it) – it gets worse!
All I could really do is to create a new support ticket via their web form, and to use that to explain the silliness noted above and ask them to help me with that refund request (again).
When I tried to fill in my Qantas Frequent Flyer information on their complaints web form, this happened:

Yes, that’s right. Sometime in the last few days, something in the Qantas IT system now broke my ability to log in online at all.
Argh. I really can’t log in any more:

To be very clear, this is not an authentication error, it is a ‘something is broken, no soup for you!’ message coming from deep inside the Qantas IT world.
I had no choice but to call the Frequent Flyer Centre.
So I did.
After the mandatory 20 minutes of listening to why my call is important to Qantas, I spoke to a helpdesk person who was… totally unable to assist.
She walked me through the usual checks to see if I was a just being silly, then tried to look at the account herself. At this point she started to make confused noises about whatever she was seeing on her screen. She put me on hold. She came back.
And… (deep breath)… all she could do to ‘help’ was to say she would log a support ticket about the issue and have someone in IT take a look at it.
She warned me that the usual ticket turnaround time is… 3-5 days.
So … that’s 3-5 days when I can’t check or change my bookings online and can’t book new flights – when Qantas’ systems are successfully defending me from any further use of my credit card to pay them more money.
I booked half a dozen flights a few days ago… pity me if I needed to do that today, I’d be doing it on the phone (and being charged a ‘service fee’ penalty for annoying their phone team instead of… doing it myself online… argh!)
Deeper, in 3-5 days time, there’s no guarantee they’ll actually fix the problem.
For all I know, I might get another email back with another invalid support ticket number in it, asking me for some critical item of data in order for them to fix their problem with their IT system.
And now, this…
I have a feeling that the ‘login prohibited’ issue might be related to a weird message I’ve had on my screen whenveer I log in, for a few months now.
It tells me there’s something (unspecified) wrong with my profile, and includes a link to my personal profile, so I can fix the (unspecified) problem.
I filed a support ticket about that, ages back, and got an email reply offering to call me about it if I would tell them when was a good time to call.
I did that and they did not call me.
They sent me another email claiming I didn’t answer their call (hint: not true, no missed calls, nothing) and asking me to call them instead, and to quote my support ticket number over the phone.
I did that.
After half an hour of being painfully guided through every single aspect of my profile, the support staff member could only agree with me that nothing was wrong with it, and all she could offer me was (and I am really not kidding) …
… instructions for how to lodge a new support ticket about my problem.
Argh!

That issue remains to this day. Unresolved, and apparently unresolvable.
Let’s not even start to talk about the other support ticket I filed (a few weeks ago) with no reply received at all. That is the one where I asked Qantas to convert a flight credit into a refund because I hit ‘credit’ by mistake when I was canceling a (fully refundable) fare I no longer needed. Apparently that support ticket is off in some other pocket of purgatory, waiting for a change in the weather.
Meantime, for the lack of an escalation path, I am here on the Internets whacking keys in frustration, in the hope of some catharsis, while my curry cooks in the Thermomix.
… So for me, catharsis smells like Beef Rendang.


You must be logged in to post a comment.